The first half of the year has been filled with a series of worries and shocks. A looming trade war. Rising interest rates. A stronger U.S. dollar. Anti-European Union sentiment in Europe. A potential nuclear showdown with North Korea.
Yet for all its gyrations and mood swings, U.S. equities made progress in the first half of the year, up 2.5%. International equities fared worse, with the MSCI All Country World Index excluding the U.S. ETF down -4.0%. Emerging markets were particularly hard-hit, with the iShares MSCI Emerging Markets ETF down -7.4%.
We are likely in the late stages of the economic cycle – and one of the longest equity bull markets in history. What does that mean for the next few months and second half of the year?
NEXT FEW MONTHS: NEUTRAL
Over the last few months, we have reduced equity exposure in our portfolios, with the highest reduction being in international equity. Per our April blog post, international equities have significantly underperformed U.S. equities since 2011. Over the long-term, we expect a convergence of U.S. and international equity markets, but near-term, our models have indicated that it’s time to manage risk. For example, emerging equity markets have fared the worst, including China’s Shanghai Composite Index down -15.7% for the year. We expect to re-invest in equities, but for the moment, are content to be more defensive given some of the uncertainties discussed below.
Market seasonality is another reason why we are happy to be sitting on some cash. “Seasonality” refers to particular timeframes when stocks, sectors, and indices are subjected to and influenced by recurring themes that produce patterns. As indicated in the chart below, most equity indices tend to have their best performance between October and May. The Volatility Index and Treasury bonds tend to have their best performance between May and October, when historically market volatility spikes and money managers buy Treasury bonds as a risk mitigation strategy.
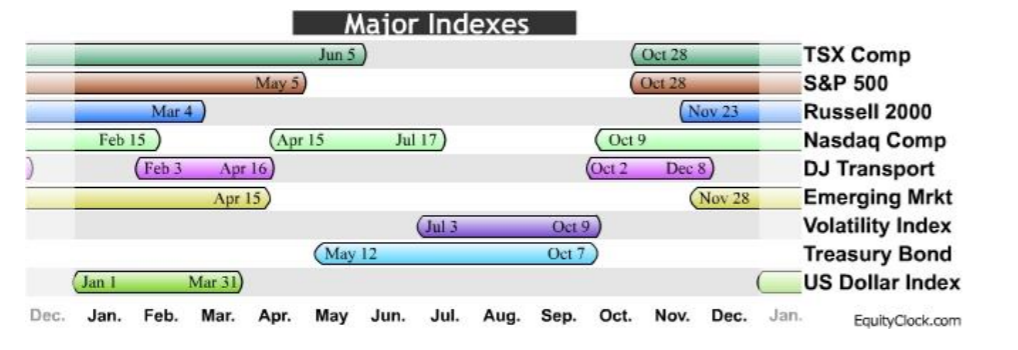
While we don’t trade based on market seasonality, it’s interesting when our models reflect higher risk during these “unfavorable” seasonal periods.
LONGER-TERM: MILDLY BULLISH
While equity market corrections (down > 10%) are common, the end of a secular (long-term) bull market like the one we have been experiencing since March 2009 is a rare event. We are sure you remember the last secular bear market that started in 2000 and didn’t end until 2009. During that period, the S&P 500 Index fell nearly 50% from 3/2000 – 10/2002 and recovered just over 100% before falling nearly 57% from 10/2007 – 3/2009.
We are watching closely for any one, or a combination of, indicators that would signal the end of this bull market. The economy and the stock market are in a push-pull situation, with tax cuts and corporate earnings providing tailwinds; and tariffs, rising interest rates, and geo-political uncertainties providing headwinds.
But, we don’t see a recession on the horizon yet, which historically is the hallmark of a coming bear market. Rather, the U.S. economy is chugging along, with corporate earnings looking strong. And while the Federal Reserve has continued to raise interest rates, rate hikes have been measured, reflecting a healthy economy.
The current potential “fly in the ointment” is an escalation of a trade war and tariffs with our trading partners, particularly China. We would like to think that China and the U.S. will sort out its trade disputes – after all, we need each other for a robust, vibrant economy. But, we see this as a very prolonged negotiation, and one with an unclear outcome. In the meantime, any escalation in trade tariffs will likely be viewed as inflationary and may impact the Fed’s “go slow” approach to interest rates. And this kind of uncertainty has the potential to unsettle equity markets.
In conclusion, we see elevated levels of volatility persisting, with the possibility of a correction over the next few months – fueled by the above-referenced items, as well as the upcoming congressional elections in November. We also don’t see what would push the S&P 500 Index above the all-time highs of January.
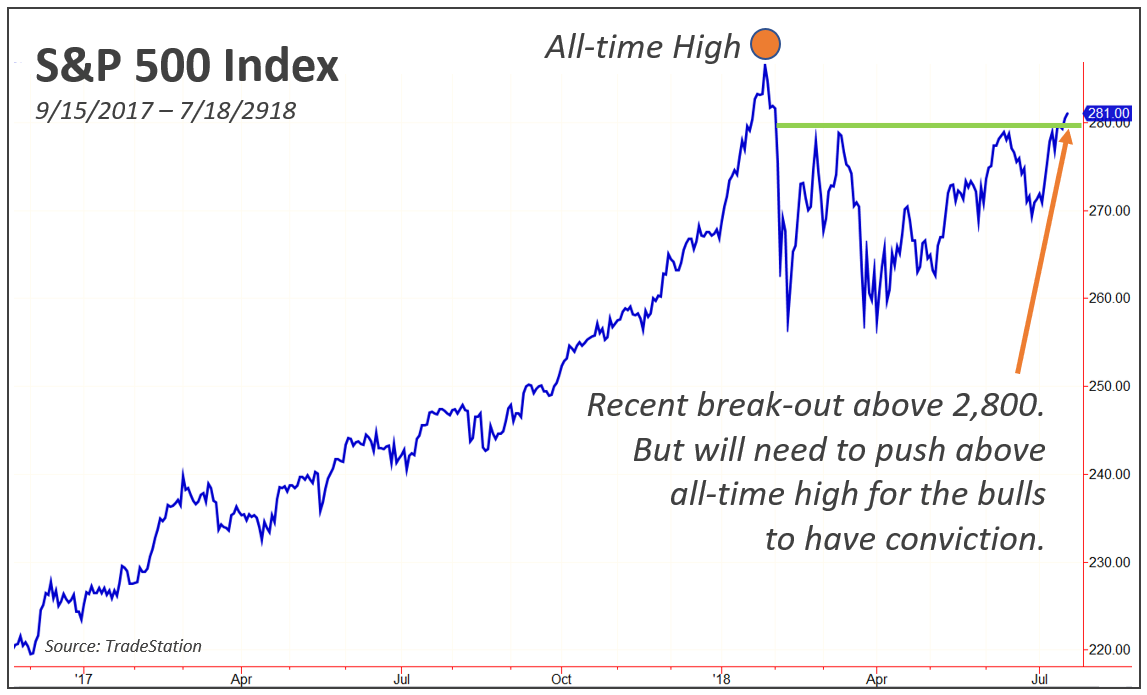
We don’t think this secular bull market is over and we believe that we will experience the traditional year-end rally in equities. The question between now and then is “will equities correct?”