Wow. What a year! The bull market in equities caught fire around the world, with the S&P 500 ETF up +21.7% and international markets as represented by the Europe, Australasia and Far East Index ETF (EFA) up +25.1%! With rising interest rates and continued uncertainty about the Federal Reserve’s posture, particularly with the new Fed Chair arriving in February, bonds fared much worse, with the Core Total U.S. Bond ETF up +3.7%.
Given such a strong year, what can we expect for 2018?
We have already seen strong performance for January, with the S&P 500 Index up over +6% since the start of the month.
What’s driving this continued strong performance?
- Tax Reform for Individuals.Individual income tax rates have been reduced pretty much across the board, and tax bracket thresholds have been increased. This means that taxes will be lower on short-term capital gains, ordinary dividends, and interest income, with consumers keeping more of their money to spend or invest.
- Tax Reform for Corporations. Corporate tax rates have been reduced from a tiered rate schedule (15%, 25%, 34%, 35%) to a flat 21%. This means corporations will have more money in their pocket to hire employees, implement capital improvements, and/or do share buy-backs.
- Powerful Momentum. As Isaac Newton’s first law states, “an object in motion tends to remain in motion in a straight line unless acted upon by an outside force.” Equity markets have pretty much been moving in a straight line up since Trump’s election. Market participants view him as “market friendly,” and the performance of the stock market has certainly confirmed this.
What could be the “outside force” that knocks the markets off balance?
- Rising Interest Rates. The Federal Reserve (“Fed”) has increased rates four times since December 2015 and will likely raise rates 3-4 times this year. Watch for an inverted yield curve, where short-term interest rates (driven by Fed decisions) become higher than long-term interest rates. Historically, inversions of the yield curve have preceded many of the U.S. recessions. Due to this historical correlation, the yield curve is often seen as an accurate forecast of the turning points of the business cycle; the stock market is a leading indicator of the business cycle, typically starting to decline before the business cycle slows.
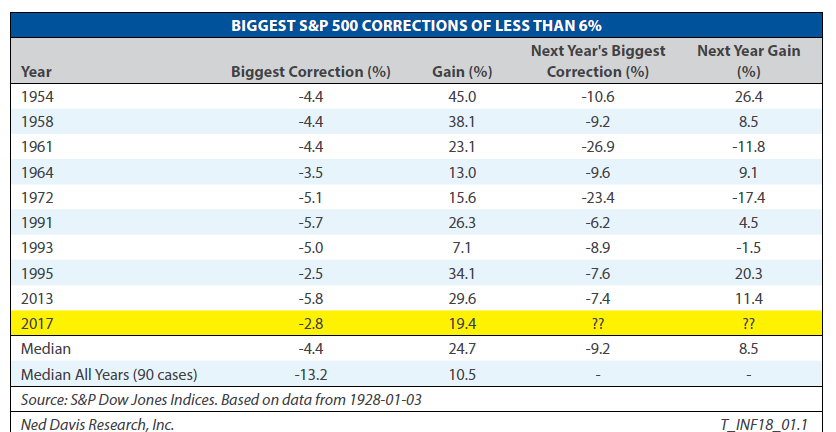
- Unsustainable Low Volatility. Whether it’s the government shutdown, turmoil in the White House or North Korea nuclear jitters, nothing seems to faze this stock market. Friday marked the 400th trading day since the last time the S&P 500 declined at least 5%, breaking the record set in 1995.*
As you can see from the chart below, years with low volatility and large gains tend to be followed by a year with a substantial correction, the median being -9.2%.
Conclusion
We expect 2018 to end the year on a high note, but as we move into the year with a new Federal Reserve Chair in February and likely higher interest rates, we expect volatility to increase. The US dollar has also quietly been declining, which can fuel inflation, giving the Fed another reason to hike interest rates. Watch the Fed. Watch the yield curve. Watch the US dollar. These three will likely have a big influence over the market over the coming year.