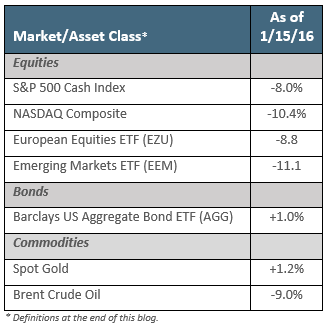
2015 ended with a whimper, with the S&P 500 Index down -0.7% for the year. However, the markets entered 2016 with a roar, with the S&P 500 Index down -8.0% as of 1/15/16. The market is considered forward looking – a leading indicator, providing insight regarding the probability of a recession. While we are always cautious about prognosticating about the direction of the market or the economy, we do want to provide possibilities for 2016, as well as a recap of 2015.
2015 Review
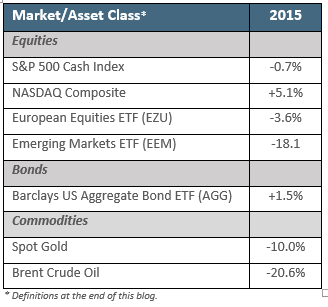
While not a huge fan of Jim Cramer, his saying, “There is always a bull – or a bear market – somewhere” is relevant. While the S&P 500 Index closed relatively flat for the year, this was not the case for all market and asset classes, as shown below:
Global central bank policies, as is often the case, was a primary driver of equity market returns.
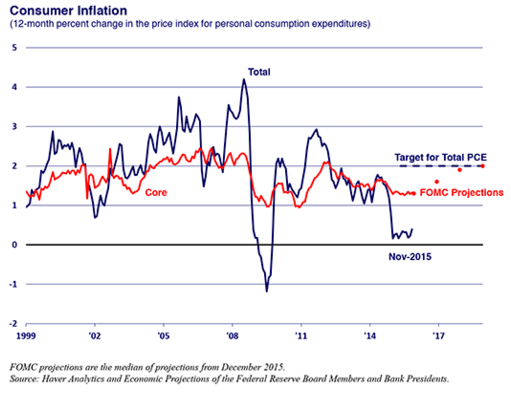
- US Equities After what felt like a very prolonged discussion, the Federal Reserve finally raised rates by 0.25% in December – the first time in nearly a decade. The Fed has two mandates – “maximum employment, and manage inflation.” The Fed’s target for inflation is 2%. As you can see from the chart below, the US inflation rate has been hovering around this rate for years. This, coupled with an unemployment rate of 5%, provided the fodder for the Fed to take the first step in raising rates.From the perspective of sticking to its mandate, the increase in rates was long overdue; however, some felt it was still too soon given that global economies are still recovering. Was the timing of the rate hike supportive of the market? Clearly not – however, propping up the market is not a mandate of the Federal Reserve.
- Developed Markets Faced with steady, if moderate, growth and stagnant prices, the European Central Bank (ECB) extended it’s Quantitative Easing (QE) policy, and cut its deposit rate to -0.3% in December. Yes, you read that right. The ECB cut rates below 0%, implementing negative interest rates. (Now savers can put money in the bank with a guarantee to lose money!) These moves supported the market for a while — European stocks, as represented by the iShares MSCI Eurozone Exchange Traded Fund (ETF)*, was up +12.0% before peaking in mid-May 2015. However, confidence soon waned, with the EZU down -3.6% for the year.
- Emerging Markets China’s central bank adopted its own version of QE to cushion a slowdown in its economy. Additionally, Beijing surprised everyone by devaluing its currency last August, effectively making their exports cheaper. This seemed like a positive step. However, since then, Beijing has twice altered the way the yuan is priced against other currencies. The unpredictability of the currency policy, coupled with the fact that debt levels ballooned to $28 trillion, added to concerns that Beijing was losing its grip on the world’s second-largest economy. Markets are intelligent – the central bank’s moves temporarily supported Chinese equities with the iShares China Large Cap ETF (FXI*) up 26.6% early in the year. However after peaking, confidence waned, with the FXI ending the year down -15.2%.
We can’t wrap up our review of 2015 without talking about oil. Energy prices continuing their slide, with Brent oil down just over -35%. The oil industry has a history of booms and busts, and it is currently experiencing its deepest downturn since the 1990s, or earlier. Since peaking in 2011, Brent prices have declined a whopping -77.1%! (This is yet another reminder of why we don’t apply a “buy and hold” investment approach.) Why the bust? It all boils down to supply and demand. On the supply side, the oil producers around the world continue to drill for oil and push product into the marketplace. On the demand side, the economies of Europe and developing countries were still climbing of recessions. Will this cycle reverse? Yes. Super-cycles and trends on all asset classes reverse at some point. When will it reverse? Pundits thought that $40 per barrel was the bottom. As of Friday, Brent stood at $28.94 a barrel. The answer is, no one knows.
In short, it was a year where equity markets began to shift gears – largely driven by the route in energy prices and shifting central government policies.
2016 Outlook
There is an adage in this business – “As goes January, so goes the year.” US equity markets have kicked the year off down more than almost any year in history, with the S&P 500 Index down -8.0% as of 1/15/16. Other markets, with the exception of gold and US Treasuries, are also down substantially:
What’s driving this? Many point to the following:
- A “Long-in-the-tooth” Bull Market Since 1930, the average bull market has lasted about 97 months.** The current bull market, which began in March 2009, is approximately 82 months old.
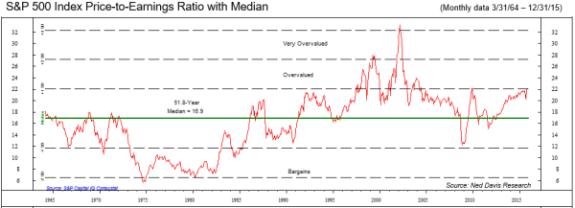
- US Equity Valuations The S&P 500 Index price-to-earnings (P/E) ratio continues to be elevated by historical standards, indicating that US equities are expensive (see chart below.)
- Credit Markets Rising interest rates have a negative effect on bond prices. High-yield bond funds already experienced substantial redemptions last year, forcing fund managers to sell in order to meet these redemptions. As a result, the entire high-yield market has come under pressure, and will likely continue to experience more redemptions as we move through the year, placing pressure on equity markets.
- Oil Price Deflation Per the above.
- China Economic Woes Per the above.
Some are questioning whether the above factors warrant such extreme volatility. After all, economic news in the US has been fairly positive, again with the US experiencing low inflation and full employment. Additionally, both European and Chinese central banks have been, and will likely continued to support their economies through interest rate and QE policies.
The bottom line is that it doesn’t matter if “it’s warranted.” Markets are forward looking, and market participants are sending a signal of potential uncertainties and threats to global economic growth.
That said, we would caution investors from panicking. The S&P 500 is up over 200% since bottoming in March 2009. A decline of nearly 11% since peaking on 11/3/15, while scary, is not surprising – and a breather will help refresh a market long overdue for a correction (defined as a decline of +10% or more.)
Are we entering a bear market (defined as a decline of +20% or more)? We don’t know. However, what we do know is:
- Prices of the major indices (S&P 500 Index, Dow Jones Industrial Average, NASDAQ, Dow Jones Transport, Russell 2000) have deteriorated since peaking in late 2015, with overall price trends beginning to point down, rather than up.
- US corporate earnings, which are a good projection of future economic growth, are beginning to report for Q4 2015, with 2016 guidance indicating a reduction in earnings and revenues.
- Global economies, particularly emerging markets, continue to struggle, with China pointing to the possibility of a substantial slowdown.
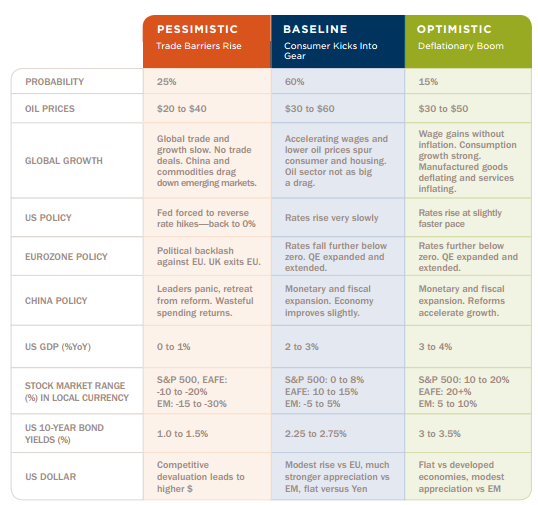
Below is a chart from RiverFront Investment Group’s 2016 Outlook. (RiverFront is a Richmond-based mutual fund manager we respect a lot.) We agree with their assessment for the upcoming year.
(Click 2016 Outlook for a PDF version of the above table.)
We like this table as it’s a reminder that there are no absolutes in this business – only probabilities. While we’d all like to know the future – where the market will be next month, in two months, at the end of the year – the fact is, as mentioned, no one knows. It doesn’t matter if the fund manager was “right,” in his/her projection last year. This year, s/he may not be as lucky.
Conclusion
Our clients know that we use a data-driven approach to help us to determine when and what to buy, and when to reduce positions. Currently, none of our portfolios are 100% invested in equities, and our models are signaling a further reduction in exposure. This type of data-driven approach, while not perfect, helps take the emotion out of what is often an emotional process – and helps us manage risk by seeking to minimize losses during substantial bear markets.
Regardless of where the S&P ends the year, we do believe that 2016 will continue to be volatile. In other words, it’s likely time to fasten your seat belts.
Be well,
Roberta
* Data Sources: S&P and NASDAQ – Ned Davis Research; Exchange Traded Fund (ETF) – Trade Station; Brent and spot gold prices – Bloomberg.
S&P 500 Index – A market-capitalization weighted index that measures the performance of 500 large cap stocks, which together, represent about 75% of 75% of the total US equity market.
NASDAQ Index – A market-capitalization weighted index of the more than 3,000 common equities listed on the Nasdaq stock exchange. MSCI EAFE index measures the equity performance of developed markets, excluding US and Canada. The index consists of indices of 22 developed markets.
Barclays Aggregate Bond ETF (AGG) – The fund’s bogy, the Barclays U.S. Aggregate Bond Index, is the generally accepted benchmark for the U.S. investment-grade bond market and includes mortgage-backed securities, Treasuries, and corporate bonds.
Spot Gold – Is the current price of gold, as opposed to the security’s future price.
Exchange Traded Fund (ETF) – An ETF is a marketable security that tracks an index, a commodities, or bonds, or a basket of assets like an index fund. Unlike mutual funds,, an ETF trades like a common stock on a stock exchange. ETFs experience price changes throughout the day as they are bought and sold. ETFs typically have higher daily liquidity and lower fees than mutual fund shares, making them an attractive alternative for individual investors. ETFs discussed in this blog:
EZU (iShares MSCI Eurozone ETF) – A broad, market-cap-weighted exposure to stocks listed in the Eurozone. It invests in large- and mid-cap companies based in 10 developed-member countries of the Eurozone.
EEM (iShares MSCI Emerging Market ETF) – A broad, market-cap-weighted exposure to equities from 23 emerging-markets countries.
FXI (iShares MSCI China Large-Cap ETF) – This ETF tracks an index that includes the 50 largest Chinese companies listed on the Hong Kong exchange.
** Source: http://www.forbes.com/sites/robertlenzner/2015/01/02/bull-markets-last-five-times-longer-than-bear-markets/
*** RiverFront Investment Group is a mutual fund and ETF provider, headquartered in Richmond, VA. https://www.riverfrontig.com/about/team/
Alexis Advisors, LLC is a Registered Investment Advisor with the Commonwealth of Virginia. Information contained herein is for informational purposes only and is subject to various interpretations and timeframes, and should not be considered investment advice. Please contact Advisor promptly if there are any changes in your financial situation or investment objectives, or if you wish to impose, add or modify any reasonable restrictions to the management of your account. Since the confidentiality of internet email cannot be guaranteed, do not include private or confidential information such as passwords, account numbers, or social security numbers. Additionally, instructions having financial consequences such as trade orders, fund transfers, etc. should not be included in your email communications, as we cannot act on unconfirmed instructions received via email. Nothing in this transmission should be construed as an offer or solicitation to purchase or sell securities. Investments in securities and insurance products are not FDIC insured, not bank guaranteed, and may lose value. Advisor’s current Disclosure Brochure is set forth on Form ADV Part 2 and is available for your review upon request.

